DSM Logistic Temperature Model Documenation
temperature-model.RmdChinook supplementary analysis for Chinook DSM models
Objective
Within the get_rearing_survival() DSM submodel,
aveT20, aveT20D, maxT25, and
maxT25D are defined as inverse logit models whose inputs
are monthly stream temperatures. The purpose of these models is to
provide a sub monthly metric derived from monthly data, and these
metrics are needed to calculate survival probabilities. The script below
outlines the parameterization process of these models.
Data Sources
Central Valley River Temps: This analysis is done using data from the Full temperature data.csv. The Central Valley River Temps include the following stations from USGS:
And the following stations from CDEC:
Delta Temps: This analysis is done using the following data:
- DUTCH SLOUGH.csv (USGS: 11313433 )
- GEORGIANA SLOUGH.csv (USGS: 11447903 )
- JERSEY POINT.csv (USGS: 11337190)
- LPotatoSLough.csv (USGS: 11336790 )
The Delta temperature datasets can be obtained using USGS
dataRetrieval R package using the corresponding site number
listed above. For example to download the data for Jersey Point,
jersey_point <- dataRetrieval::readNWISuv(siteNumbers = "11337190", parameterCd = "00010", startDate = "2009-12-11")Temperature Data
The table below shows the Central Valley and delta temperatures grouped by month and year. It is summarized to give monthly mean temperature, the proportion of days over 20°C, and the count of days per month over 25°C.
Logistic Regression models
This data was prepped to model the proportion of days in a month with temperature over 20 °C. If the temperature goes above 25 °C, logistic regression was used to model this phenomenon.
To allow for logistic regression model use, we made the following edits:
We adjusted 0’s to .001 and 1’s to .999.
We appended an additional column to our data containing the odds ratio by taking
log(Proportion Exceeding 20/(1 - Proportion Exceeding 20)).We edited our
Number of Measures Exceeding 25 degreesto create a binary column describing when the temperature exceeds 25 in a month (1) and when the temperature does not exceed 25 in a month (0).
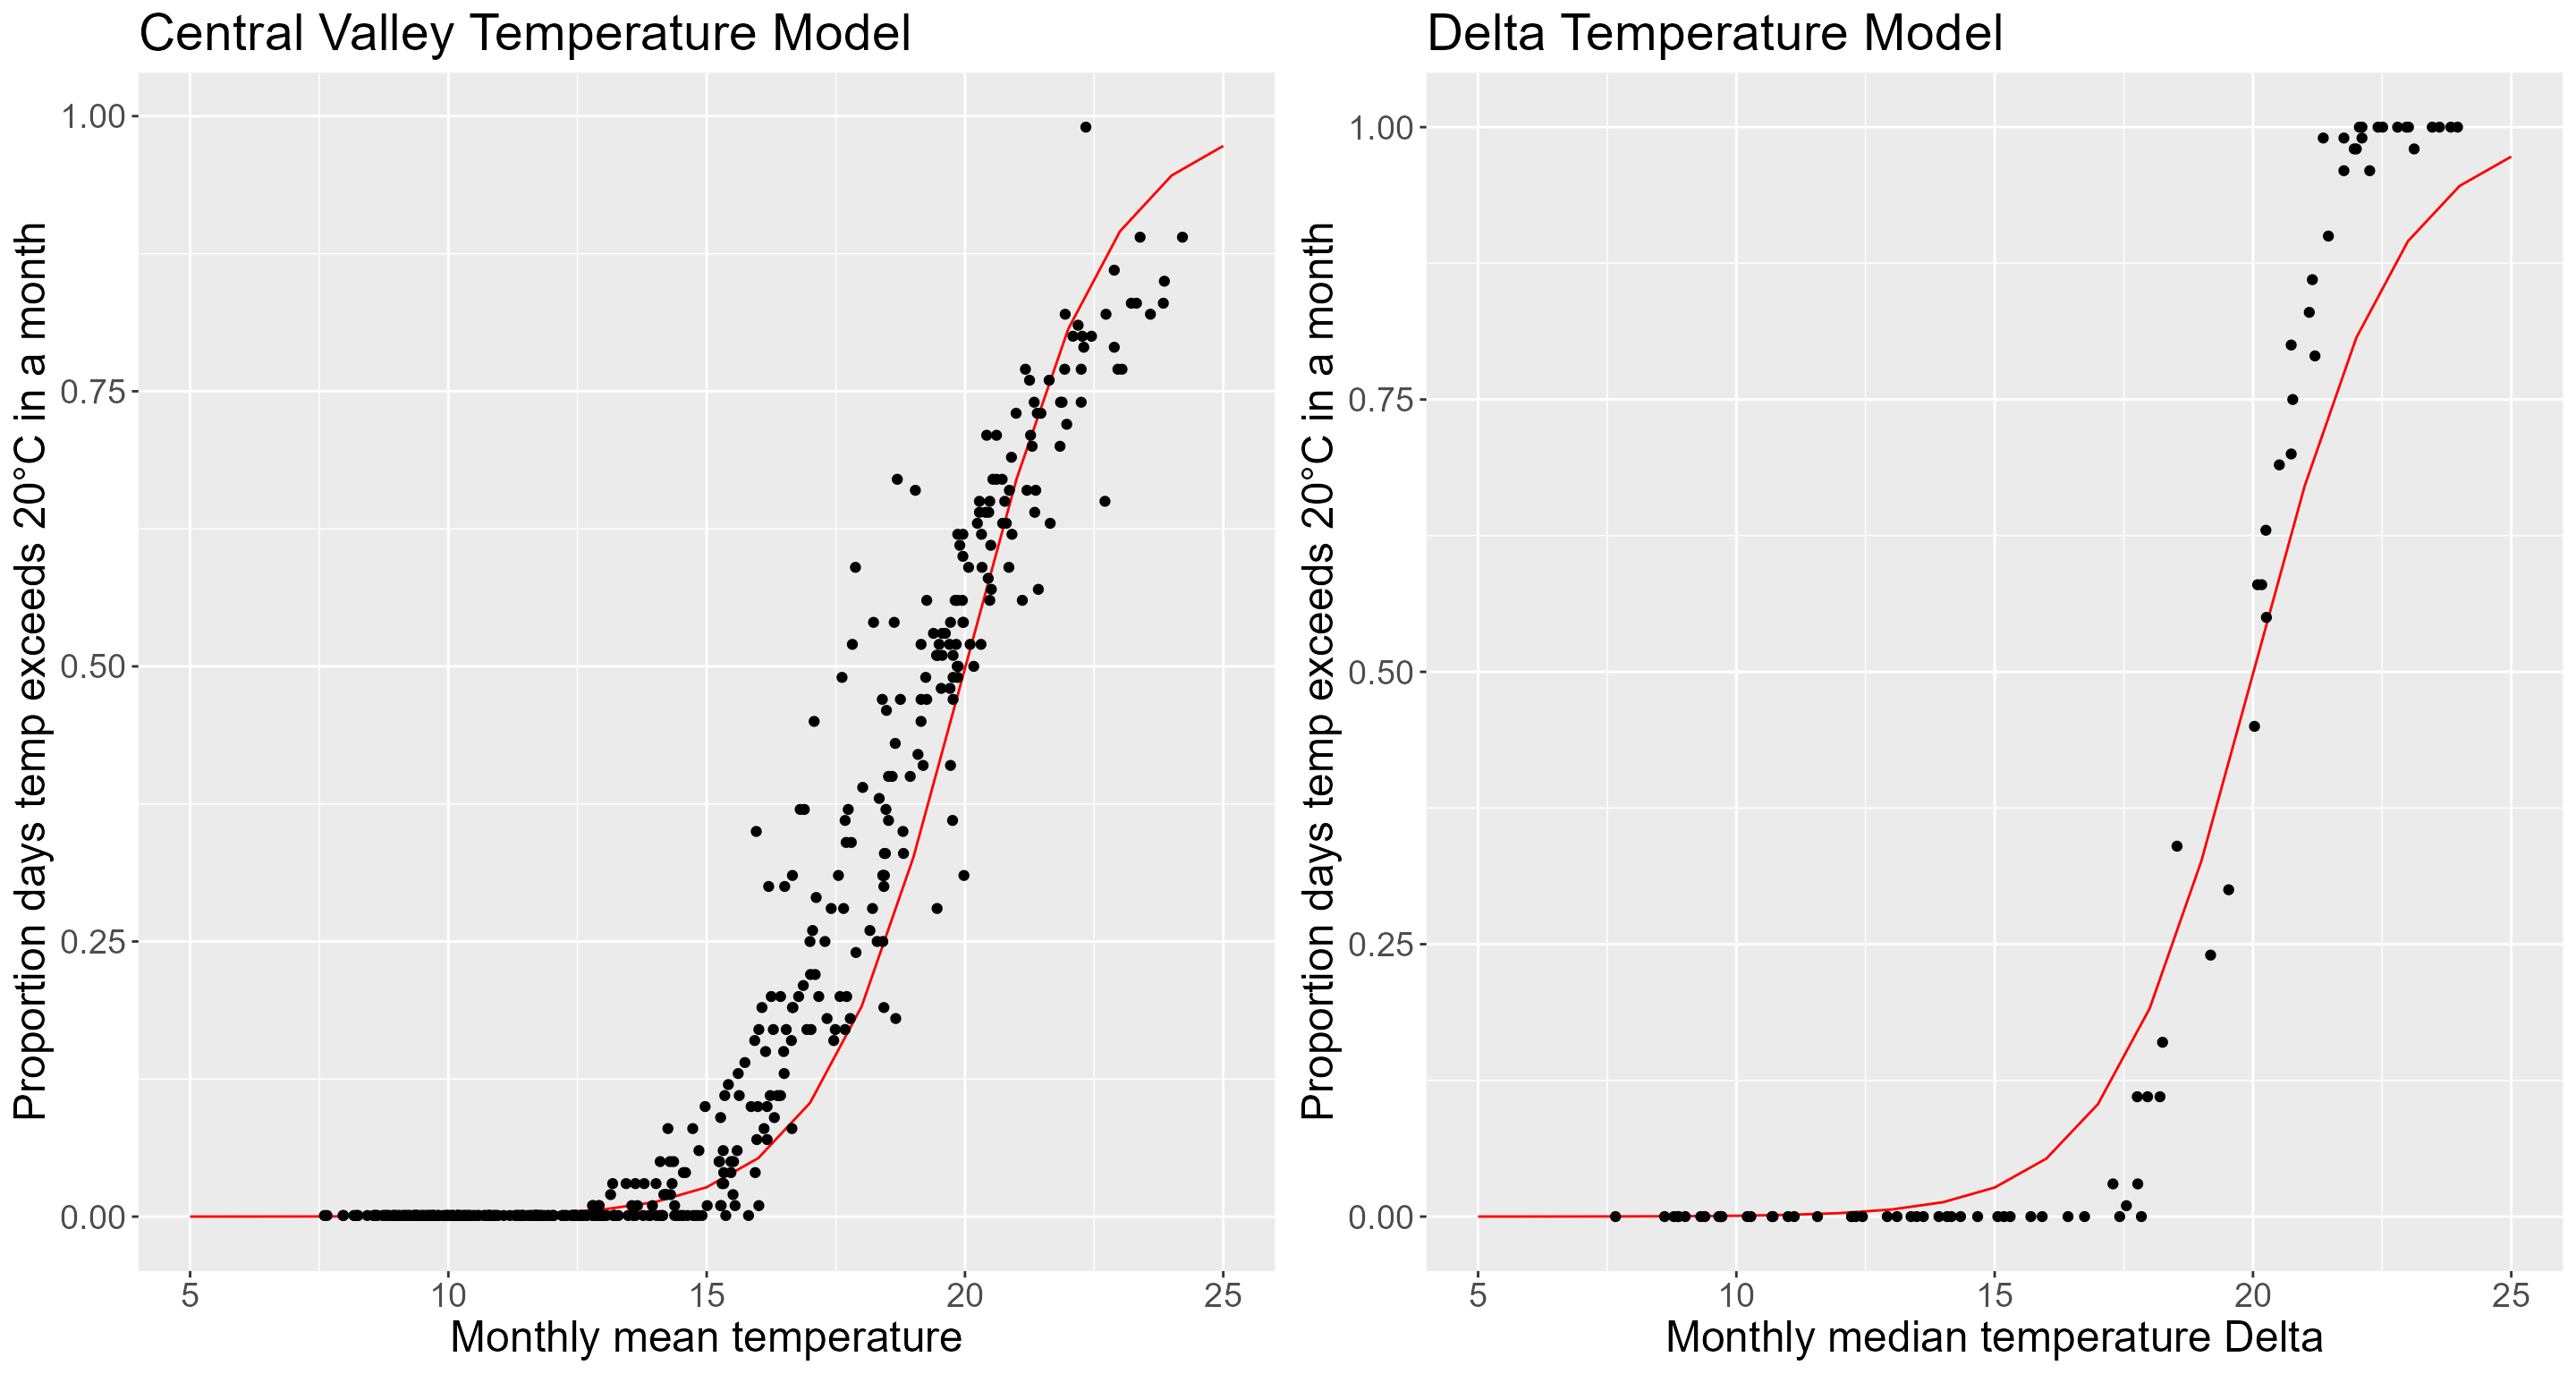
Results: proportion of days where temperature exceedes 20°C in a month
We parameterized the model for the proportion of days where the
temperature exceeds 20°C in a month by fitting a linear regression model
between the log odds of the proportion of days in a month greater than
20°C, and the monthly mean temperature. The logit values resulting from
this are converted back into proportions using the
boot::inv.logit. The resulting models are,
Delta
\[ prop = inv.logit(-18.18765 + 0.9560903 \times temperature)\]
Central Valley
\[ prop = inv.logit(-14.36524 + 0.7178891 \times temperature)\]
The scatter plots below show the mean monthly temperature and the proportion of measures greater than 20°C for the Delta and Central Valley Rivers. The red line is our logistic model prediction where the monthly temperature ranges between 5°C and 25°C.
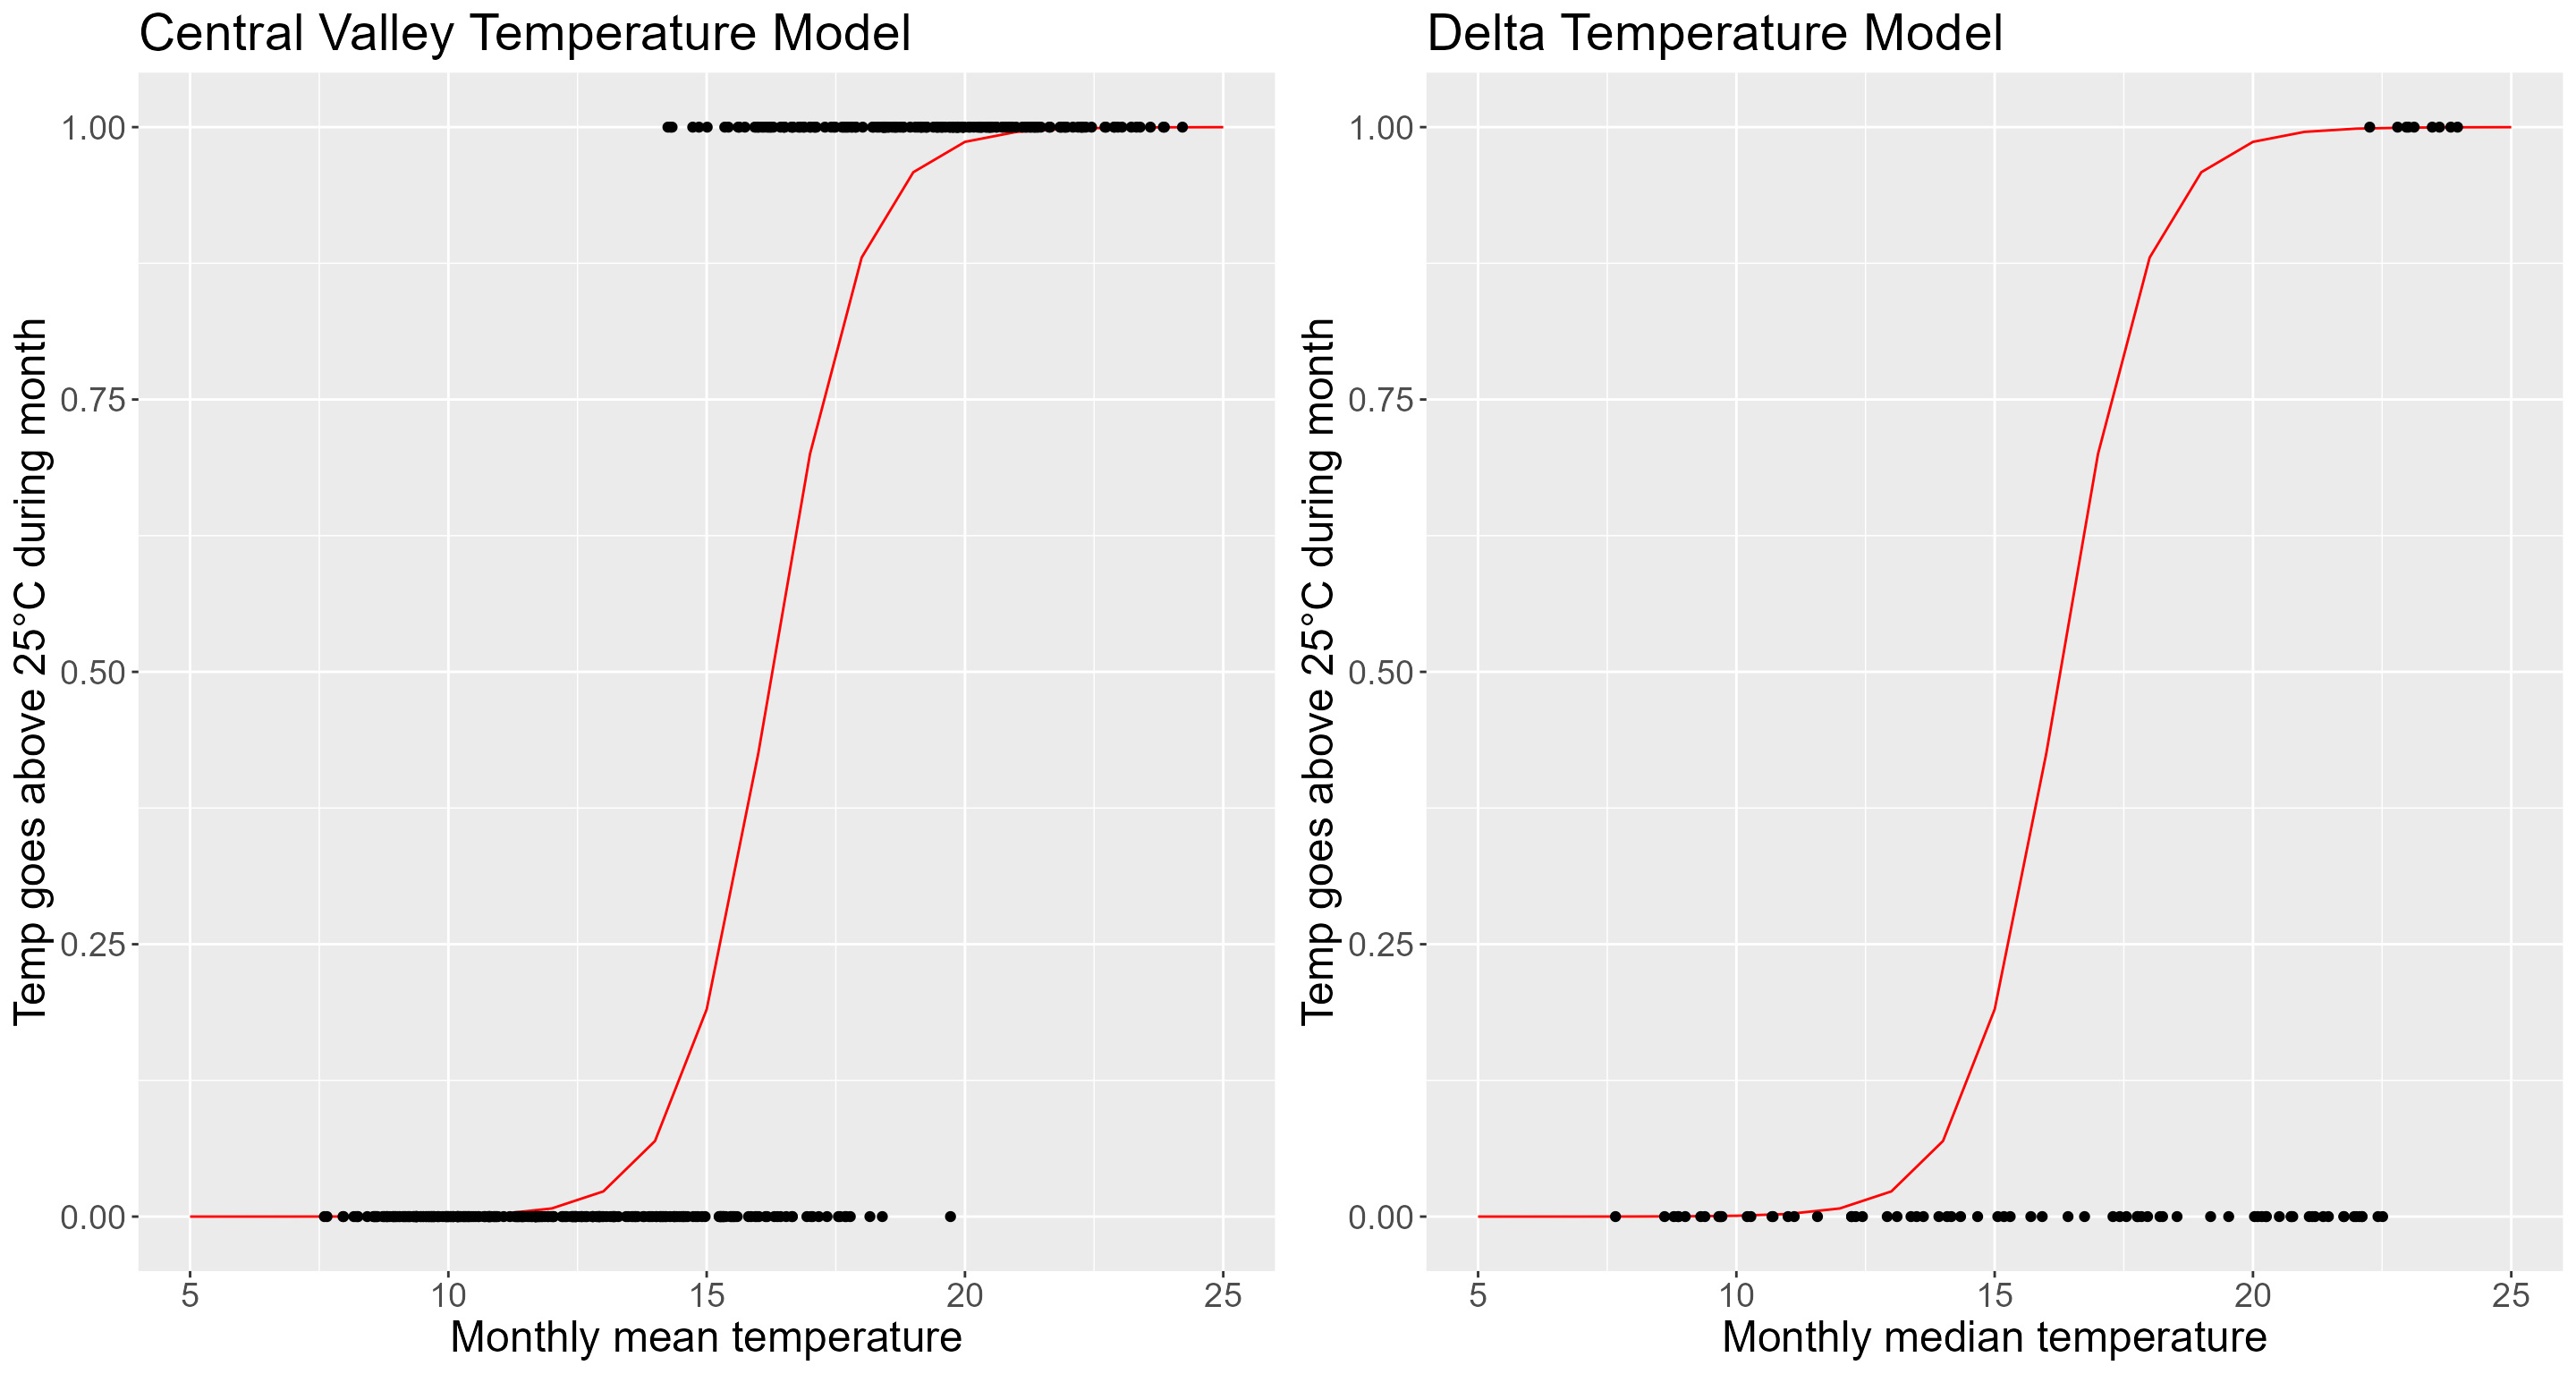
Results: temperatures exceeding 25°C during a month
The model for predicting when the temperature exceeds 25°C during a month is fit using a logistic regression where we regress the binary variable representing an occurrence of temperature greater than 25°C onto corresponding mean monthly temperature.
The resulting models are:
Central Valley
\[P_{> 25} = inv.logit(-18.66548 + 1.147803 \times temperature)\]
Delta
\[P_{> 25} = inv.logit(-155.563 + 6.910016 \times temperature)\]
The scatter plots below show if temp exceeds 25°C for a given mean
monthly temperature in the Delta and Central Valley Rivers. The red line
is our logistic model prediction based on the numeric input defined
above (boot::inv.logit(Numeric Input)):